

 |  |  | 6.4 Origin and processes of nutrient transformation in the river continuum |
Starting from the levels in the streams at the head of the basins, whose water is a mixture of surface runoff and groundwater, the nutrient content evolves from upstream to downstream of the hydrographic network partly because of point discharges of nutrients and partly because of the processes that transform, immobilise or eliminate them during their transfer downstream. In order to build a model it is therefore necessary to estimate the input of nutrients.
Dissolved inorganic forms of nutrients (Si, N, P) control algae growth. In water affected by agricultural soils leaching (already in the headwaters), heavily loaded with nitrates, phosphorus is the limiting element. In zones with large domestic and industrial discharges (e.g. in order 5 of the Seine basin), phosphorus is, on the contrary, in excess (Table 2). The silica produced by rock weathering is relatively constant in time, and is in excess compared to the phosphorus (Table 2). However, the large input of nitrogen and phosphorus can modify the ratio to a point where silica becomes limiting, in particular when the uptake by phytoplankton greatly lowers the concentrations [].
Diffuse sources are taken into account through mean nutrient concentrations in each of the the two components of runoff (surface- and groundwater flow) as calculated by the HYDROSTRAHLER model. Regarding surface water, these concentrations are calculated from the land use in the watershed and from a coefficient of transfer through the riparian zones []. The composition of the water from phreatic aquifers is obtained by an inventory of the concentrations in the aquifers [].
| RR | Seine | Marne | Oise | Eure | Main axis | |
| Diffuse sources, kT,y-1 | 25.3 | 13.9 | 16.6 | 14.3 | ||
| N | 25.3 | 13.9 | 16.6 | 14.3 | ||
| P | 0.3 | 0.2 | 0.2 | 0.1 | ||
| Si | 24.5 | 14.7 | 19.8 | 8.5 | ||
| N/P | 7.2 | 84 | 69 | 83 | 143 | |
| Si/P | 40.2 | 82 | 73 | 99 | 85 | |
| Si/N | 5.6 | 0.96 | 1.01 | 1.19 | 0.59 | |
| Point sources, kT, y-1 | ||||||
| N | 5.1 | 2.6 | 4.7 | 1.4 | 40.3 | |
| P | 1.6 | 0.9 | 1.4 | 0.4 | 7.1 | |
| N/P | 7.2 | 3.2 | 2.9 | 3.4 | 3.5 | 5.7 |
A study carried out on the treated and untreated wastewater in the Paris urban area [][] made it possible to convert the variables provided by sewage networks and treatment plants into state variables in the RIVE model. Biological oxygen demand (BOD) is for example converted into different fractions of organic carbon and a relationship between BOD and heterotrophic bacteria is used.
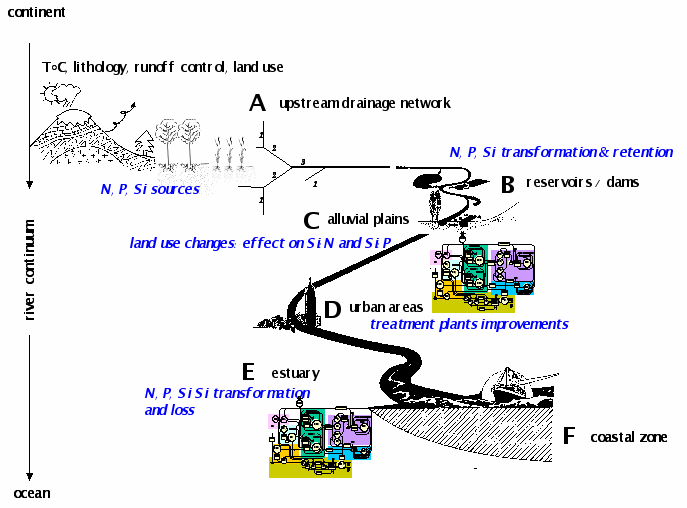
In any aquatic continuum, from head waters to the coastal zone, the nutrient load can be reduced by a variety of processes related to the biology (uptake, retention in the biomass, elimination), the hydrology (dilution), the geo-morphology (retention) (Figure 5).

Ecological processes can strongly modify the dynamics of nutrients along a river continuum but the nutrients issued from point source discharges generally have a relatively constant flux, independent of the flow rate in the receiving river, whereas the diffuse inputs are closely linked to its flow rate.
It has therefore often been proposed that the flux-flow rate or the concentration-flow rate relationship be used to define what shares of the load have a diffuse or a point origin at a given station. The limitations of this method are due to the need for simplifying assumptions which are not always verified. Thus, to consider the base flow as constant is the same as saying that any increase in the flow rate is due to an inflow of surface water whereas a distinction should be made between floods containing a large component of surface water and those that are mainly due to aquifer recharge since the two might have very different effects in terms of nitrogen and phosphorous transport.
Contrarily to dissolved inorganic silica and nitrogen mostly immobilized or eliminated through biological processes, inorganic phosphorus, although kept low by the algae throughout the vegetative period in the upstream rivers, is largely transported as particulate inorganic phosphorus (44%) at the outlet of the Seine), of which (20 to 35%) deposited in the flood zones but probably re-suspended during floods and transported downstream [][]. In this case, the retention of the phosphorous is temporary and only delays its transport. Note that in periods of strong floods, deposits in the flood zones of particulate phosphorus were estimated to be around 10 g P m-2y-1 in the alluvial plain of the Seine (average over the last 40 years, []).
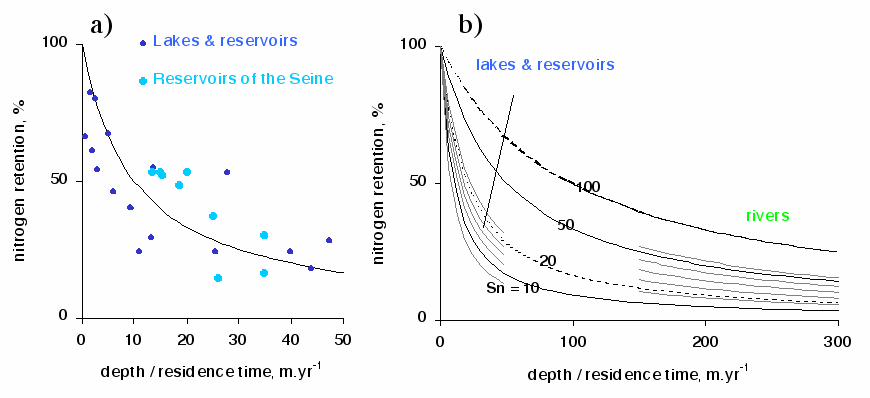
Regarding nitrogen, largely is excess compared to the algal requirement in river networks devoted to agriculture due to fertilization (from 50 to 250 kg ha-1 in Eastern and Western and European countries respectively), elimination mechanism in the watersheds is mainly due to denitrification process. Denitrification transforms nitrate into gaseous nitrogen that escapes into the atmosphere, this process definitely eliminates the nitrogen from the aquatic medium. Because denitrification is an anaerobic process, it occurs mostly in the riparian zones of the hydrosystems [][], or in the water column of rivers or lakes when they are deep and anoxic and enriched in organic matter [][]. Such conditions are frequent at low flow in the rivers strongly impacted by waste water treatment plant, rich in organic matter as it used to be in the Seine downstream of Achères WWTP (end of the 70'ies) or in the Scheldt estuary before domestic wastewater effluents, those of Brussels city especially, were treated (end of the 90'ies). A great deal of the nitrates arriving from the upstream basin, as well as those produced by the nitrification of ammonia, were actually eliminated in this way but, fortunately, wastewater treatments have been widely implemented and improved due to successive European Directives for rehabilitation of surface water quality, so that the denitrification process in rivers themselves is, at present, essentially benthic. Its power to eliminate nitrates depends on the level of organic matter in the sediments, on the depth of the water column and on the residence time of the water masses in contact with the sediments. This dependence can be quantified with the model by Kelly et al. [] (Figure 3). In stagnant systems, e.g. lakes, reservoirs and ponds, benthic denitrification can easily eliminate 80% of the incoming nitrate load as observed in the large reservoirs of the Seine [][]. Therefore, the stagnant annexes can be efficient denitrification sites in the whole hydrographical network, but their role at the outlet of the river is often limited due to the upstream situation of these hydraulic annexes.

In most large Western Europe rivers, around 200 species of phytoplankton can be inventoried of which half belong to the diatom family (brown algae with a siliceous shell), and half to the Chlorophyceae (green algae) and the others are distributed between Cyanobacteria (blue-green algae), Dinophyceae, Chrysophyceae, Euglenophyceae (Seine: Garnier et al., []; Meuse and Mosel: Descy, [], Everbecq et al., [], Schöl et al., []; Lot : Capblancq & Dauta, []; Qotbi, []; Loire: Leitao & Lepretre, []; Rhine: Schöl et al., []). The centric diatoms generally dominate the communities in the spring, sometimes accompanied by pennated diatoms, the Chlorophyceae being characteristic of summer. The Cyanobacteria, typical of eutrophic systems, but known to be unable to form large populations in turbulent systems [][][], are however found in significant numbers in rivers during periods of pronounced low flow but equally in eutrophicated stagnant systems connected to the river from which they originate [][][].
As it is not possible to routinely determine the specific composition and the biovolume of phytoplankton through the microscope at the scale of a watershed basin, it is often easier to use other biomass estimators; the amount of chlorophyll being the basic variable generally determined from a carbon: chlorophyll a ratio. In the Seine, this ratio is on the order of 35-40 [].
The Redfield ratio (1958) C/N/P (106/16/1 in moles, i.e., C/N = 5.68 g g-1, N/P = 7.2 g g-1, C/P = 41 g g-1) establishes the average phosphorus and nitrogen needs of algae. For the silica needed by diatoms, one must also take into account the molar ratio of Si/C = 0.4 mole/mole (0.98 in g g-1) [][]. Thus, the N:P:Si ratios in the water are compared with those of the organisms to define nutrient limitations. Moreover, the seasonal evolution of these ratios determines the ecological succession of the species []. In the model, these ratios are used to take into account the limitation of the phytoplankton by nutrients but also to calculate the seasonal and spatial dynamics of these elements.
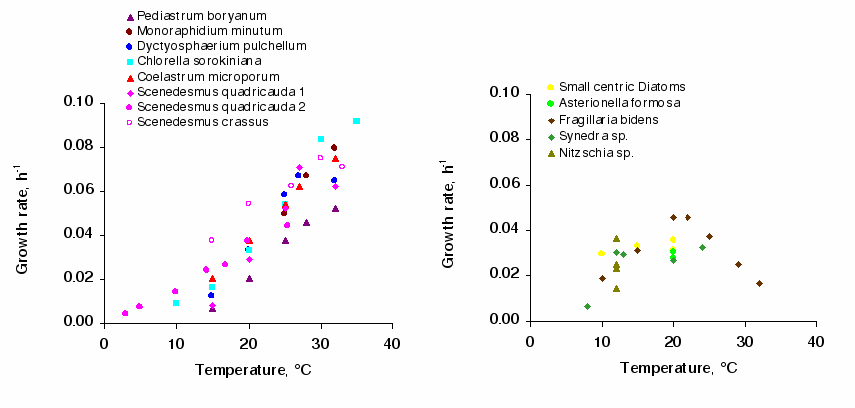
The process of synthetising biomass is considered to follow Michaelis-Menten kinetics in relation to the external concentration of nutrients (N, P, Si): µ=µmaxCN,P,Si/CN,P,Si + kN,P,Si where C is the N, P, Si concentration and k is the half-saturation constant, the concentration for which µ= µmax/2. This constant characterises the affinity of algae for nutrients. Below this value, one considers that there is limitation. This approach does not take into account the decoupling of nutrient uptake from the algae growth which, if the algae have stored reserves, may continue in conditions that are a priori limiting [][][][]. Phytoplankton species and/or communities can be identified by their µmax and k, µmax being also dependant on the temperature (Figure 7; Table 3; [][][] and other references in Garnier et al., []).

| Diatoms | Chlorophyceae | |
| Topt (°C) | 19-23 (21) | 33 (37) |
| dti (°C) | 12-16 (13) | 21 (17) |
| Growth rate at Topt, h-1 | 0.04 (0.03-0.05) | 0.08 (0.09-0.06) |
| PBm at Topt, µg C µg Chl a-1 h-1 | 5 | 1.4 |
| kpSi (mgSiO2L-1) | 0,13-0,17 | |
| 0.25 (SD=0.26, n=37) | - | |
| KsP (µg P L-1) | 4.3-5.9 | 1.1 |
| 7.1 (SD =15.8, n =32) | 46.1 (SD= 55.2, n=20) | |
| Ks (µg N L-1) | 14 independantly from the species |
|
Silica may become limiting when diatoms build up a high biomass, in the spring, due to excess in phosphorus, causing dissolved-silica depletion []. The sedimentation of their frustules may cause significant silica retention at that time, especially in the sectors of the hydrographical network where algae growth is the strongest or in reservoirs, when their residence time is long enough and strongly stratified [347][][].
Besides a bottom up control by nutrients, phytoplankton is submitted to a top down control by animal filtration. In rivers, zooplankton is actually dominated by small organisms that have a short generation time and do not exceed 1000 ind l-1 in the Seine [][]. These organisms are weak feeders 2.3 to 5.9 µL.ind-1 h-1) in contrast to benthic organisms (e.g., the fresh-water mussel Dreissena polymorpha) that have a mean abundance reaching 200 to 500 x 106 individuals within the 160 km of the canalised sector and a high filtration rate, 16.5 µL ind-1 h-1 for the veliger and veliconcha larvae [][][]. Similar density of Dreissena are found on the other canalised river (the Mosel: []; the Rhine: []). Taken into account the Dreissena in the model clearly showed their role to sudden declines of phytoplankton.
Apart from Dreissena filtration, the assumption of massive phytoplankton death by viral, bacterial or fungal infection cannot be excluded ; many studies show that a phytoplankton biomass consisting of single-species populations is particularly vulnerable to viral lysis [][][].
 |  |  | 6.4 Origin and processes of nutrient transformation in the river continuum |