


 |  |  | 6.5 Modelling phytoplankton and nutrient in drainage networks |
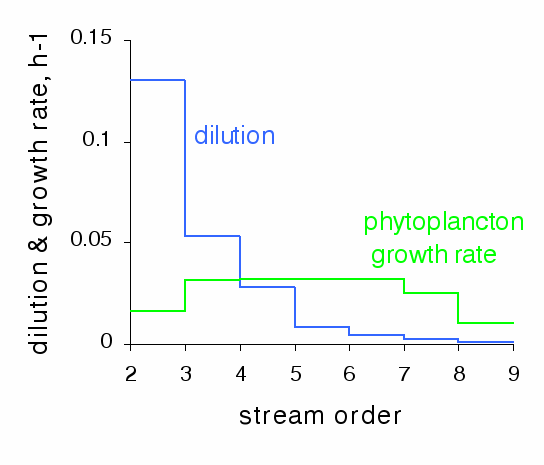
By coupling the hydrological and ecological models, it is possible to calculate the mean phytoplankton growth rate, integrated over the water column, at any point in the hydrographic network. Phytoplankton only develops when its growth rate is higher than the rate of dilution by lateral inflows. Therefore, phytoplankton can only grow significantly in rivers from order 5 upward (Figure 8). As the depth increases with the order, the mean phytoplankton growth rate decreases in the higher orders under light limitation. The low growth rates upstream are the result of nutrient limitation.
As described above, the model is able to adequately simulate the seasonal variations of phytoplankton in the main sub-basins as well as in the main axis of the Seine River (Figure 9). As predicted by the comparison between the dilution rate and the phytoplankton growth rate, the phytoplankton biomass is only significant from order 5 upward and therefore increases from upstream to downstream. In accordance with the observations, the model predicts a spring peak dominated by diatoms and a summer peak dominated by Chlorophyceae. In the downstream part of the sub-basins, the model reproduces the sudden declines in spring bloom. In the summer, phytoplankton biomass again increases downstream of Paris and reaches its maximum in the estuary, downstream of Poses [].

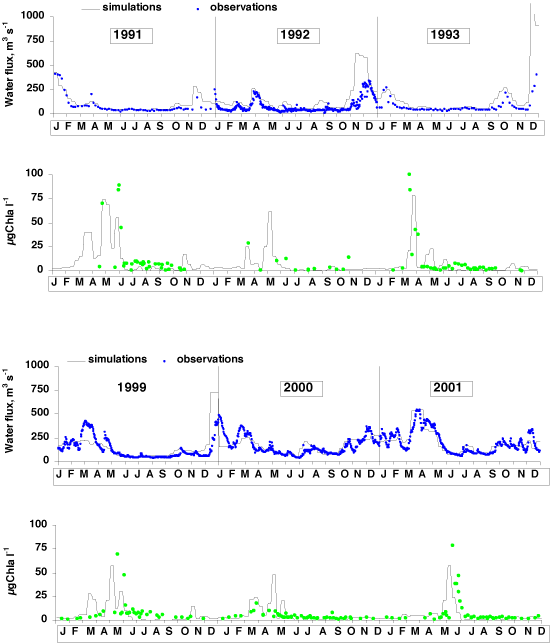
Simulations of the seasonal variations in phytoplankton biomass are also shown for 10 different years with various hydrological conditions at the outlet of the Marne sub-basin, taken as 9 sub-basins (Figure 10). The control of the spring bloom of phytoplankton by the flow rates is confirmed. As soon as the flow rates have decreased in late winter or early spring, the phytoplankton builds up a large biomass that remains high if the water flow stays low (in 1991, 1993, 1997). The early spring bloom can be disrupted by a late rainy event (in April 1998), whereas when high flow rates are maintained until spring, the bloom may be delayed and reduced in intensity (in 1995 and 1999).
The model was used to investigate in what conditions the different nutrients might become limiting for the phytoplankton and what would be the impact on its mean summer and spring levels (Table 4).
| N | P | S | |
| Chl a % | |||
| 0.01 | 47.8 | 25.9 | 19.3 |
| 0.1 | 94.2 | 44.3 | 22.8 |
| 0.3 | 99.4 | 76.9 | 39.5 |
| 0.5 | 100.0 | 96.6 | 48.6 |
| 1 | 100.0 | 100.0 | 100.0 |
| 1.5 | 100.0 | 101.9 | 119.2 |
| 3 | 100.0 | 103.3 | 125.0 |
At the sub-basin outlets where the phytoplankton decline occurs, phosphorus and nitrogen are not limiting. Regarding silica, river algal bloom dominated by diatoms may temporarily bring down its concentration to very low levels which would doubtless be limiting for the phytoplankton.
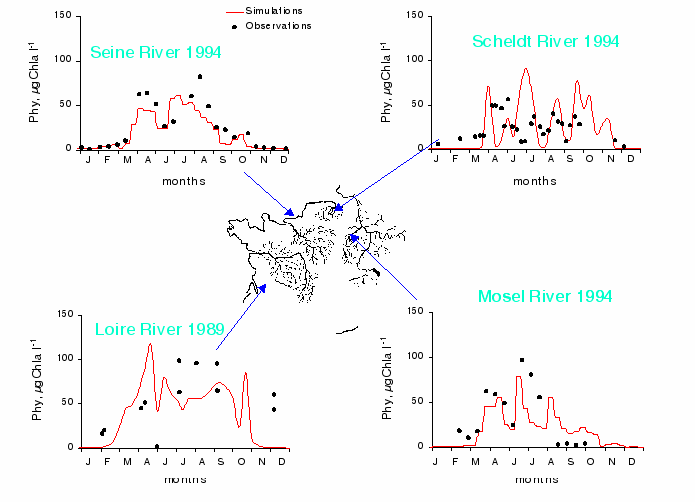
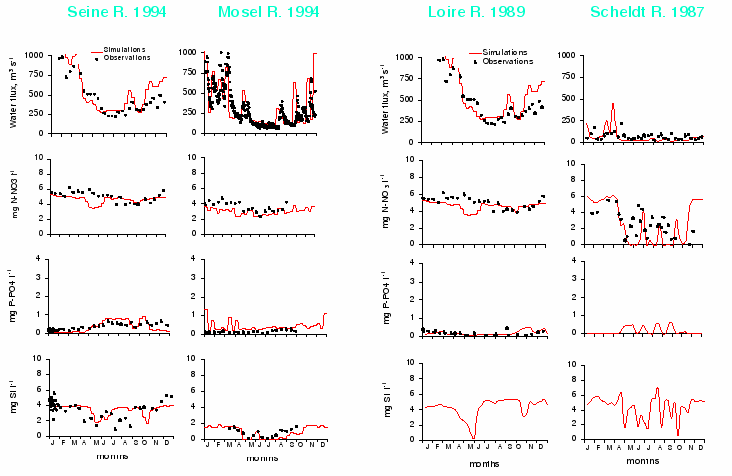
Most of major Western European rivers have been extensively studied but rarely in an integrated manner, at the scale of their watershed basins. Because of the modular structure of the RIVERSTRAHLER model, it is possible to adapt the procedure to each case. The four rivers chosen here are situated in morpho-climatic domains similar to that of the Seine []. They can therefore be used to explore an increasing gradient of population density and of agricultural and industrial activity: their watershed basins are fairly small (Table 5). At their mouth the stream-orders are 8 for the Loire and the Seine, and 7 for the Mosel and the Scheldt. The hydrological regimes are all characterised by winter and early spring floods and summer low flow. The population density increases clearly from the Loire to the Scheldt according to a South-North gradient. As in the case of the Seine, human activity has greatly contributed to altering the hydrological regime of the rivers (navigation channels, wetlands draining, construction of reservoirs for flood protection). Among the rivers, the Loire is relatively untouched by engineering works, although it has two large dams in the upstream sector, there is no navigation.
| watershed | mean | max. | depth | reservoirs | % arable | popul | |
| systems | area, km2 | discharge | order | regul. | land | density | |
| m3s-1 | inh, Km2 | ||||||
| Seine | 64 500 | 420 | 8 | yes | 3 major | 46 | 195 |
| Loire | 116 000 | 580 | 8 | no | small | 38 | 63 |
| Scheldt | 6 200 | 80 | 7 | yes | none | 39 | 426 |
| Mosel | 17 890 | 300 | 7 | yes | none | 20 | 190 |
In classical ecology [], the trophic state of a system is determined by the equilibrium between the autotrophic metabolism that produces oxygen and the heterotrophic metabolism that consumes it. On this basis, one can therefore establish a diagnosis of the autotrophic-heterotrophic state of a system and its variations in time and space. Autotrophic-heterotrophic diagrams (P/R diagrams) show, on the y-axis, the intensity of the metabolic production of oxygen or carbon in the system (P, algal photosynthesis) and on the x-axis, that of the processes of oxygen consumption or of organic matter degradation (R, respiration of bacteria, zooplankton and the benthos as well as of phytoplankton). In this type of diagram, the systems at equilibrium have an oxygen concentration at saturation level and fall on the diagonal, with increasing distance from the origin as the biological activity rises. Predominantly autotrophic systems, net producers of oxygen, lie above the diagonal (P/R >1) while the systems dominated by heterotrophic processes, net consumers of oxygen, fall below the diagonal (P/R <1), (Figure 13). The P/R diagrams are therefore a means of summarising the trophic state of an aquatic system during its evolution in time and space. Although such diagrams can be drawn on the basis of experimental data [], the model, validated at the scale of the hydrographic network, makes it possible to calculate the values of P and R at any point in the network and in all seasons.
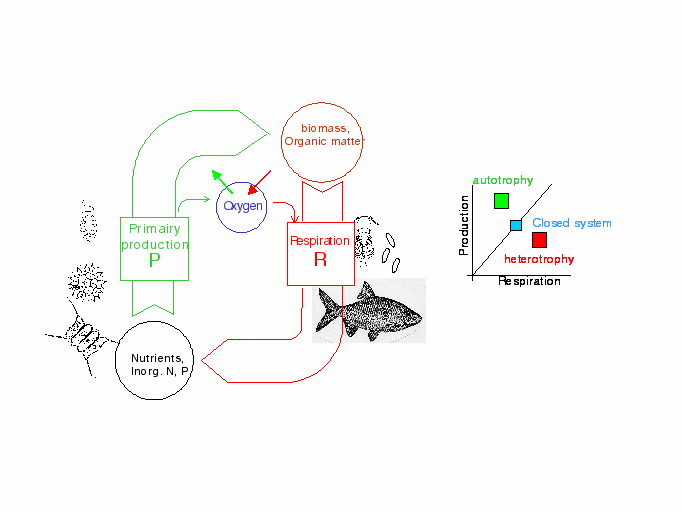
According to the river-continuum concept RCC [] a system not subjected to human intervention has an essentially heterotrophic behaviour in the lower-order streams (1 to 4) even without organic wastes inputs from urban or industrial origins. Their functioning is dominated by allocthonous fluxes of organic matter from their watershed basins and their primary production is weak. The system becomes progressively autotrophic from upstream to downstream.
The comparative analysis by the model of the P/R diagrams at a spatial scale in the 4 large rivers, shows that they, like the Seine, are very eutrophic judging by their high phytoplankton production (maxima of over 2.5 g C m2d-1). The case of the Scheldt is a special one, with heavy organic contamination that causes heterotrophic conditions in any order of the drainage network (Figure 14).
As in the Seine, the primary production in the Mosel and Loire increases from upstream to downstream, beginning in orders 4 to 5. In contrast to the Seine and the Mosel, sudden declines of the phytoplankton production, leading to heterotrophy, occur only in the estuary of the Loire. In the Mosel, the system becomes heterotrophic already at Hauconcourt, the upstream part of the canalised principal axis, and remains so until the confluence with the Rhine (Detzem). Regarding the Seine, the system becomes heterotrophic downstream of Paris, but recovers after 150 km, at Poses, where the estuary begins, only to return to heterotrophy inside the estuary (Figure 14).
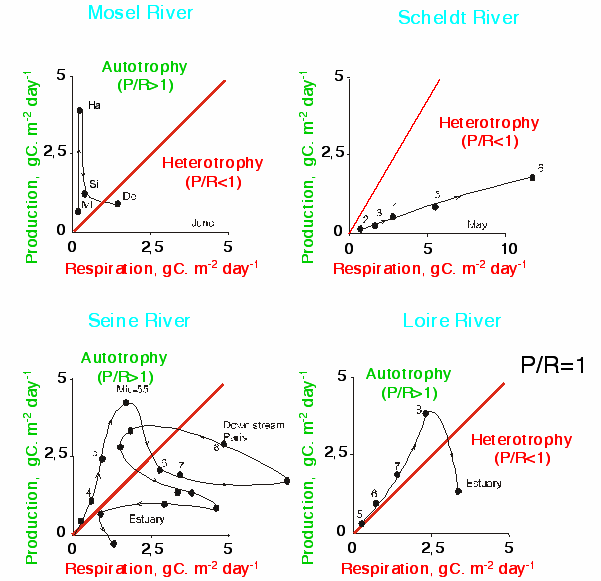
The analysis of the P/R diagrams at a seasonal scale in the Oise and the Marne tributaries of the Seine shows that the basin outlets are often heterotrophic, except in April and May, whereas the zones further upstream are always autotrophic (Figure 15). The most autotrophic sectors are those where the phytoplankton is always in the growth phase with still moderate allochthonous inputs (point sources). These sectors are then permanently oxygenated but the intense algal activity may increase the pH which poses problems for drinking water treatments []. The degradation of insufficiently treated discharges, which increase from upstream to downstream, then overtakes the algal production at the outlet of the sub-basins; phytoplankton biomass may become an autochtonous input of highly labile organic matter that leads to heterotrophic conditions (Figure 15). From the beginning of the transit through the Paris urban area, heterotrophic conditions dominate all year round (Figure 15). Downstream of Paris, after the impact of the treatment plant at Achères, these conditions become even more pronounced. A restoration phase that re-establishes an autotrophic state occurs at Poses, at the mouth of the estuary.

P/R diagrams analysis led to an interpretation of the upstream-downstream functioning of these large impacted and regulated rivers as a succession of heterotrophic and autotrophic sequences. The diagrams confirm the RCC theory but show clearly how the systems have been changed by human intervention and allow to quantify the effect of these interventions. It is clear that the strong human pressure on the Seine contributes to an increase in the alterations between heterotrophic and autotrophic conditions in the system; when the pressure is extreme, as in the case of the Scheldt, the sequence is limited to heterotrophy.
 |  |  | 6.5 Modelling phytoplankton and nutrient in drainage networks |