

 |  |  | 8.6 Gullmaren Fjord and Kattegat examples |
Two cases studies illustrate that a `threshold interval' in primary production exists where vertical export increases strongly. The pelagic ecosystem of the Gullmar fjord situated on the west coast of Sweden and adjacent waters has been studied since the late 1970s, principally in relation to oceanographic variability in the Skagerrak and the possible influence of climatic forcing on this area (Lindahl and Hernroth, 1983; Andersson and Rydberg, 1993; Heilmann et al., 1994; Lindahl et al., 1998; Belgrano et al., 1999). Primary phytoplankton productivity has been a part of these studies and a measuring program in the mouth area of the Gullmar Fjord is ongoing since 1985. An evaluation of this time series was carried out in 1994 (Lindahl, 1995), suggesting that even when elevated values of primary production are observed during the spring period (March-April), the main contribution to the annual production was found during the period May-September.
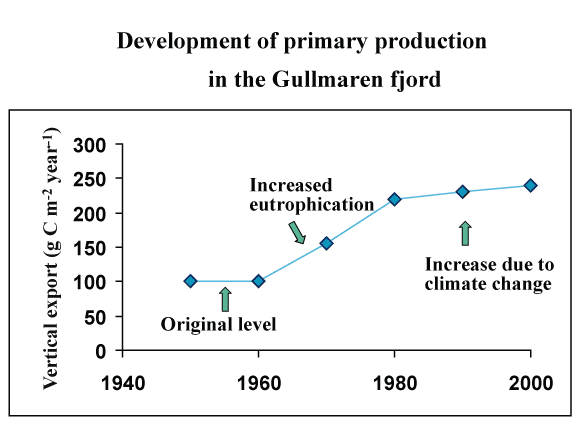
More recently a first attempt was carried out to study the effect of weather/climatic forcing on the physical-chemical processes related to the primary productivity. These results suggested the presence of an indirect link between the North Atlantic Oscillation index (NAO), the supply of nutrients to Kattegat, wind direction and the primary production (Lindahl et al., 1998; Belgrano et al., 1999). The development of primary production was reconstructed by combining measurements in the Gullmaren fjord with older measurements from the Kattegat (Figure 8). The striking increase in the 70s and 80s seems caused by eutrophication, while the slight rise is interpreted as a function of climate change. Applying the relationship suggested by Wassmann [487], the export production in the 1950/60 period was about 30 g C m-2 year-1 (PT = (?)g C m-2 year-1) while at present it is about 120 g C m-2 year-1 (PT = 240 g C m-2 year-1). If the assumptions behind these calculations are true, they imply the vertical C export increased four times over a time interval of 50 years! The carbon loading of the basin water of the fjord is obviously far greater today then during the more `pristine' times prior to 1960.

But even over the recent period significant increases in the organic load to the deep part of Gullmaren Fjord below the euphotic zone can be calculated. PE has increased from approximately 105 g C m-2 y-1 in 1985 to almost 123 g C m-2 y-1 in 2000, corresponding to an increase of the organic load of about 17% over 15 years. One possible result of this process may be the observed decrease in oxygen content of the deep water (>60 m) the beginning of the 1980s. However, it should be pointed out the decrease in oxygen may be explained by other processes as well, e.g. a change over time in deep-water exchange. Finally, it should be mentioned that the relationship between PT and PE in the fjord reflects both eutrophication (which has not increased significantly in recent years due to increased effluent control) and climate changes (variations in NAO, global warming etc.). However, to differentiate between natural and anthropogenic variability is difficult.
| Time interval | Change PT | Change PE | |
| covered (years) | (g C m-2 y-1) | (g C m-2 y-1) | |
| Storebelt | 24 | +63 | +29 |
| Øresund | 44 | +58 | +22 |
 |  |  | 8.6 Gullmaren Fjord and Kattegat examples |