 |  |  | 2.6 Measurements of deposition |
2.6 Measurements of deposition
How is the amount of nutrients deposited from the atmosphere
quantified? Why is it necessary to quantify it and how can it be done?
Basically there are two ways; measurements and modelling. Although
these ways may also be combined.
Many different measurement techniques exist, some very complex,
resource demanding and expensive in terms of equipment, some much more
simple and likewise inexpensive. In general it is less difficult to
measure wet deposition than dry deposition due to the nature of the
deposition process; the chemical components are confined to the liquid
of the rain drops, also after the deposition has taken place, whereas
the dry depositing gases are not confined and can undergo physical
transformations (e.g. re-emission). In both processes, however, the
components can undergo chemical transformations after deposition.
The basics of measuring wet deposition is to first collect the
precipitation, then analyse it for content of different pollutants.
There are two methods for collecting precipitation and numerous
techniques for the subsequent analysis. The two collection methods
are:
- Bulk sampling: The precipitation is collected in a bucket,
which is open all the time. In most cases a net prevents leaves
etc from falling into the bucket. This sampling method has a
slight tendency to cause an overestimation of the wet deposition,
because some material is also deposited when it is not raining (dry
deposition). Due to the complexity of the dry deposition process,
the amount of material dry deposited in the bulk sampler is however
much smaller than the dry deposited material in the vicinity of the
sampler. An example of a bulk sampler is presented in
Figure 7.
- Wet-only sampling: The precipitation is collected in a
bucket, which is only open when it rains. A sensor registers
whether it is raining and the lid is automatically opened at the
beginning of a rain event and closed at the end. Again some kind
of net is built into the system to prevent contamination of the
samples with organic material. This sampling method may cause
underestimation of the wet deposition depending on the sensitivity
of the sensor which determines the status of the lid (open or
closed). An example of a wet-only sampler is presented in
Figure 8.
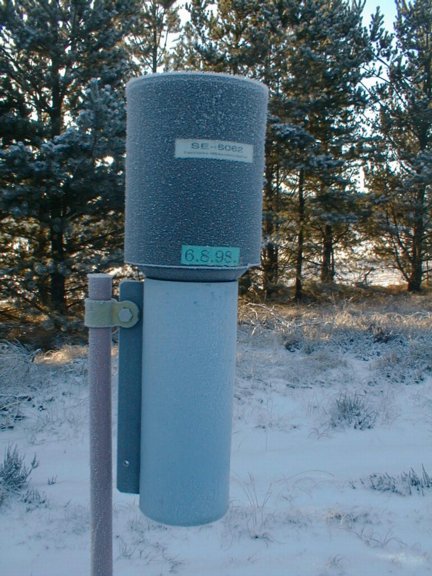
Figure: An example of a bulk sampler applied in the Danish
Background Monitoring Programme. The bottle collecting the
precipitation is located inside the grey tube beneath the
funnel (black). (Picture kindly provided by Dr. Thomas
Ellermann, National Environmental Research
Institute).
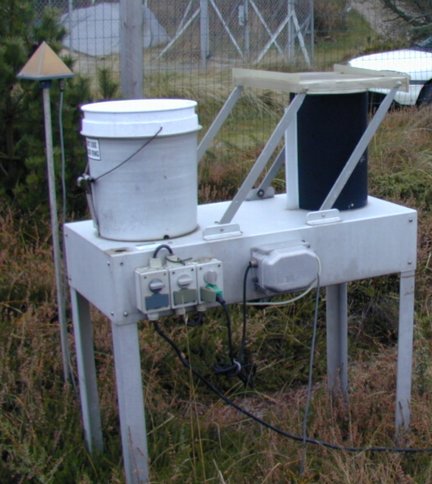
Figure: An example of a wet-only sampler applied in the Danish
Background Monitoring Programme. The black bucket contains the
bottle where the precipitation is sampled. A motor is located
inside the top of the white table and this is used to move the
lid (positioned on top of the sampling bucket in the picture).
The white bucket acts as a rest for the lid when it is raining.
To the left of the table is seen the sensor that controls the
position of the lid. (Picture kindly provided by Dr. Thomas
Ellermann, National Environmental Research
Institute).
Once the samples are collected there are many different ways of
determining what chemical components they contain. A commonly applied
technique is ion chromatography, other examples are atomic absorption
methods, spectrophotometric methods or atomic emission methods.
Measurement techniques for dry deposition can be divided into two
categories: direct and indirect. When applying one of the direct
methods the flux of the chemical component is determined explicitly.
This is done either through a collection of the material at the surface
or through a measurement of the vertical flux in the air just above the
surface. When applying an indirect method the flux is not measured
directly, instead the concentration or the vertical gradient of the
concentraion is measured. Some examples of direct and indirect
measuring techniques are listed below [411]:
- Surrogate surfaces (direct method): a surrogate surface, such
as a filter substrate, is used to collect depositing material.
This method is best for particles where the nature of the surface
is less important.
- Natural surfaces (direct method): analysis of material
deposited on natural surfaces by e.g. leaf washing or snow
analysis. This approach is ineffective for gases due to the
chemical binding of gases to the surface.
- Chamber method (direct method): deposition to surfaces in a
chamber (soil or vegetation) can be calculated by measuring the
fluxes in and out of the chamber over a given time interval. This
method is suitable for gaseous species, however establishing the
chamber is resource consuming both in terms of time and money.
- Eddy Correlation (direct method): statistical correlations of
the fluctuations in wind and concentration fields are measured to
directly obtain values of the associated vertical fluxes. If the
fluctuations correlate, high-speed measurements of vertical
velocity and concentration are used to derive the vertical
turbulent flux. Assuming theat the turbulent transport is
dominating and that chemical reactions are absent, this is a direct
measure of the local vertical flux at the measurement point, and
the deposition velocity can be obtained by dividing the flux with
the mean concentration. This method is suitable for gaseous
species, however very fast-response equipment is required.
- Eddy Accumulation (direct method): In this method air is
collected in two separate containers with the vertical velocity
determining which container receives the sampled air. One
container is used for positive vertical velocities and the second
is used for negative vertical velocities the instantaneous sampling
rate for each container is proportional to the magnitude of the
velocity. The collected air is then analyzed for the species of
interest and the results are used to calculated the net flux.
- Gradient Method (indirect method): In this method the
deposition velocity is determined by measuring the vertical
concentration gradient of the depositing chemical component and
then the theory of gradient-transport is used to determine the
associated deposition flux. An example of a gradient method
measuring system is presented in Figure 9.
- Inferential Method (indirect method): Measured ambient
concentrations at a particular reference height are multiplied by a
deposition velocity assumed to be representative of the local
surface to compute the dry deposition rate. This method is
dependent on the availability of (routine) measurements of air
concentrations and the derived values for the deposition flux are
clearly dependent on the validity of the estimated deposition
velocity.
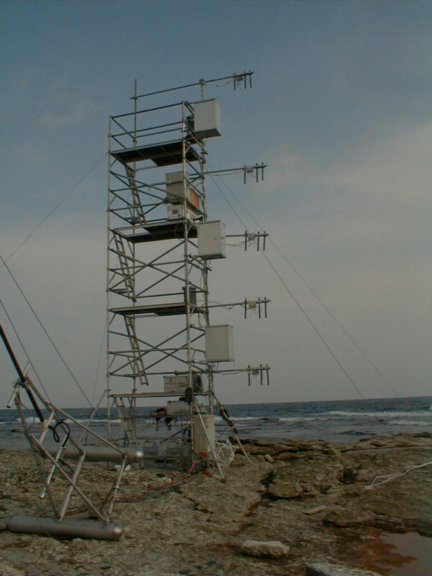
Figure: Measurements of concentrations of e.g. NH3 in
several heights can provide the basis for calculating the
deposition using the Gradient method. This particular tower
with measurements in 5 heights (the small grey tubes contain
denuders for sampling concentrations) was operated at the
island of Gotland in 1998. (Picture kindly provided by Bjarne
Jensen, National Environmental Research
Institute).
Generally the measurement methods related to micrometeorology (e.g. the
fluctuations in the wind or the direction of the vertical wind speed)
are dependent on the turbulent characteristics of the area where the
measurements are performed. In most cases the deposition fluxes
derived using these methods are representative for a larger area than
just the local area where the measurement was made. In contrast, the
methods related to the properties of the surface provide dry deposition
fluxes that are representative of the spatial scale of the piece of
surface that is analysed. Therefore if the surface characteristics are
inhomogeneous the measured deposition flux is not representative of a
very large area. In most cases the micrometeorological measuring
techniques produce results that are representative for a larger area
compared to the surface measuring techniques.
| | | 2.6 Measurements of deposition |