


| | | 10.2 Anthropogenic stressors |
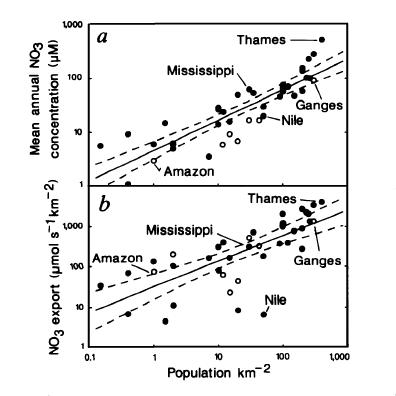
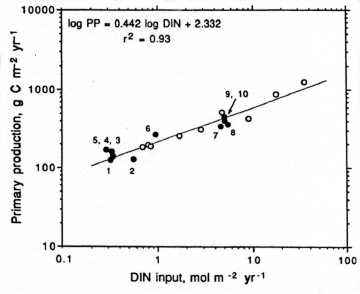
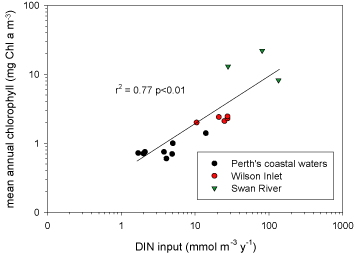
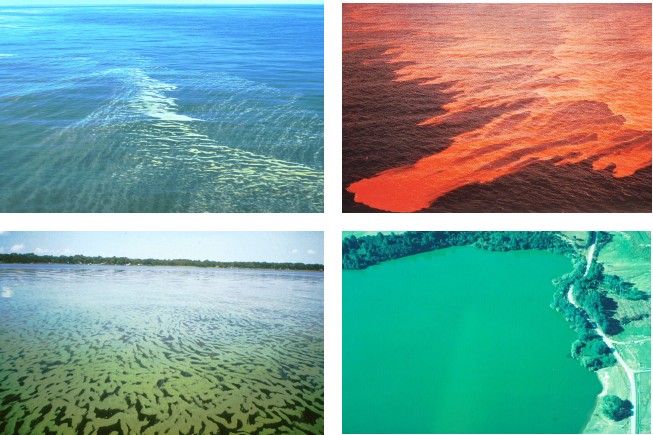
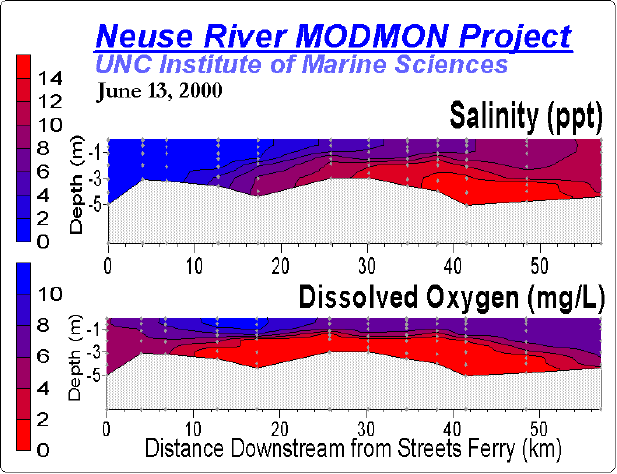
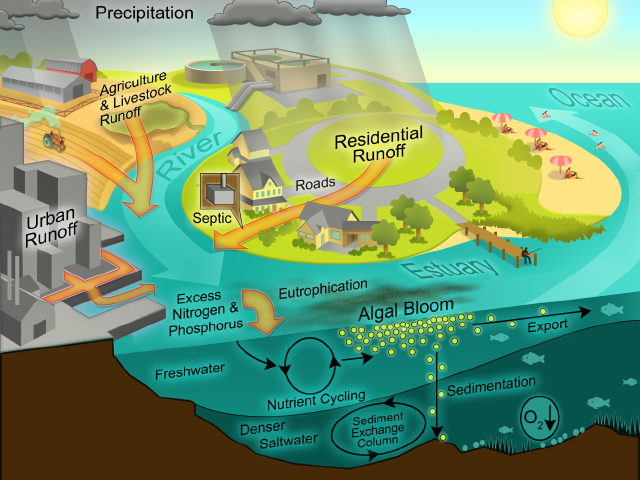
Nitrogen availability most frequently controls microbial and higher plant primary production in estuarine and coastal waters [402][342]. Concentrations and loading rates of this nutrient also most directly reflects human population density and activity in coastal water- and airsheds [368] (Figure). N inputs appear to control rates of primary production in most coastal waters worldwide (Figure 4). Not surprisingly, excessive N loading is a key causative agent for accelerating primary production, or eutrophication [342][365]. Symptoms include phytoplankton blooms, which may accumulate as ungrazed organic detritus in the sediments, providing the `fuel' for large-scale oxygen consumption and depletion in bottom waters and sediments. This chain of events is particularly problematic in salinity or temperature-stratified (no-mixed) waters, where oxygen cannot be replenished from the atmosphere (Figure). Under these conditions, persistent low oxygen or `hypoxic' conditions can alter nutrient (N, P, trace metals) cycling and promote fish disease and mortality [131][366].
A key factor promoting these negative impacts on coastal water quality is freshwater discharge (runoff). Discharge delivers nutrients to the coastal zone and determines hydrologic properties (flushing or residence time), vertical stratification, turbidity and color of the water column, all of which mediate productivity, nutrient cycling, dissolved oxygen dynamics and habitability in an interactive manner of coastal waters (Figure). For example, the rate of water discharge to estuaries, embayments and fjords controls their hydraulic residence time. Residence time, in turn, plays a critical role in determining the availability and rate of use of nutrients by phytoplankton and higher plants. Because discharge controls transport of phytoplankton through of these systems, it plays an interactive role with nutrient supply in controlling growth, competition and succession among members of the phytoplankton community. For example, high rates of freshwater discharge reduce the salinity and residence time. These conditions favor fast-growing oligohaline phytoplankton, such as chlorophytes (green algae). In contrast, low discharge conditions promote long water residence, high salinity conditions, which favor slower growing, halophyllic taxa, such as dinoflagellates and certain cyanobacteria. The differential impacts of discharge on phytoplankton community composition can be seen in the Neuse River Estuary, NC and Chesapeake Bay, MD/VA.
Using diagnostic chlorophyll and carotenoid photopigments as indicators of major phytoplankton functional groups (i.e., diatoms, dinoflagellates, chlorophytes, cyanobacteria, cryptomonads), we have examined the interactive effects of nutrient and hydrologically-driven changes of phytoplankton community composition and activity in the Neuse River Estuary (NRE), Pamlico Sound (PS) and Chesapeake Bay (CB). High performance liquid chromatography (HPLC), coupled to photodiode array spectrophotometry (PDAS) can be used to determine phytoplankton group composition based on the diagnostic photopigments. Pigments include specific chlorophylls (a, b, c), carotenoids and phycobilins. A statistical procedure, ChemTax [299] partitions chlorophyll a (i.e., total microalgal biomass) into the major algal groups, to determine the relative and absolute contributions of each group. In the NRE, key photopigment markers include Chl b and lutein (chlorophytes), zeaxanthin, myxoxanthophyll and echinenone (cyanobacteria), fucoxanthin (diatoms), peridinin (dinoflagellates) and alloxanthin (cryptomonads).
HPLC pigment analyses can be adapted to routine monitoring programs [373]. In addition, HPLC measurements can be used to calibrate remotely-sensed (aircraft, satellite) phytoplankton distributions on the ecosystem and regional scale. Using data from ongoing studies in the NRE (1994-present), PS (1999-present) and Chesapeake Bay (1993-present), it can be seen that these estuarine systems have experienced the combined stresses of anthropogenic nutrient enrichment, droughts (reduced flushing combined with minimal nutrient inputs), and in the NRE/PS since 1996, elevated hurricane activity (high flushing accompanied by elevated nutrient inputs). These distinct perturbations have allowed us to examine impacts of both anthropogenic and natural stressors on phytoplankton community structure. Seasonal and/or hurricane induced variations in river discharge, and the resulting changes in flushing rates and hence, estuarine residence times, have differentially affected phytoplankton taxonomic groups as a function of their contrasting growth characteristics. For instance, the relative contribution of chlorophytes, cryptophytes, and diatoms to the total chl a pool appeared strongly controlled by periods of elevated river flow in the NRE. It is hypothesized that these effects are due to the efficient growth rates and enhanced nutrient uptake rates of these groups. Cyanobacteria, on the other hand, showed greater relative biomass when flushing was minimal (i.e., longer residence times) during the summer..
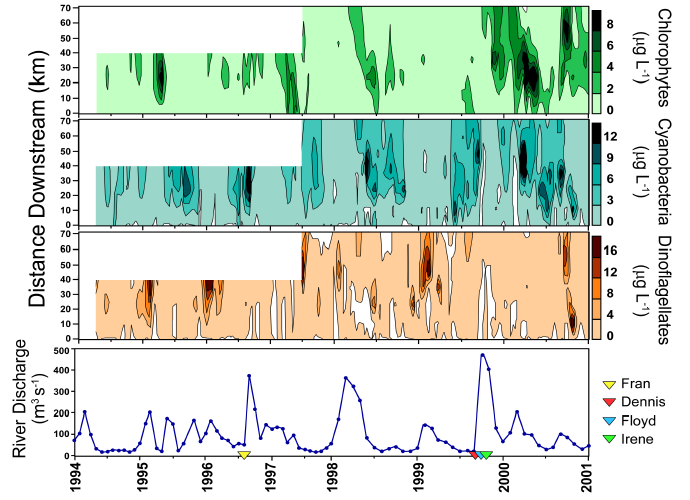
Further evidence that hydrologic changes have altered phytoplankton community structure is provided by the observed historical trends in dinoflagellate and chlorophyte abundance in the NRE. Both decreases in the occurrence of winter-spring dinoflagellate blooms and increases in the abundance of chlorophytes coincided with the increased frequency and magnitude of tropical storms and hurricanes since 1996. The relatively slow growth rates of dinoflagellates may have led to their reduced abundance during these high river discharge events. These results indicate that phytoplankton composition has been altered since 1994 in conjunction with major hydrologic changes, specifically floods following hurricanes. These phytoplankton community changes could have potentially altered trophodynamics and nutrient cycling in the NRE during these years.
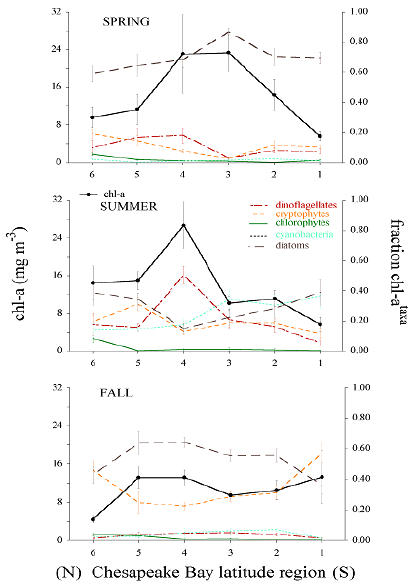
The reconstructed taxonomic composition for Chesapeake Bay also shows strong contrasting responses between dominant phytoplankton groups during spring and summer due to the variability of freshwater flow and nutrient loading. This pattern is strongest in the spring - early summer wherein high flow alleviates N limitation of the mid to lower estuary and supports diatom blooms in the spring, and sometimes in the summer. Low flow produces improved photic conditions but causes an expanded zone of N limitation in the main stem of the bay during the summer, thereby changing phytoplankton dominance to those groups that can grow efficiently under these conditions.
Depending on its source, path of travel and fate, runoff contains distinct amounts and types of nutrients. Much depends on how the watershed has been modified and impacted by human activities, including agriculture, urbanization, and industry. Therefore, when and where storms impact the watershed, their rain content and intensities significantly affect nutrient makeup and amounts discharged to coastal waters.
Freshwater discharge, in addition to its nutrient content, strongly controls vertical stratification of the water column, which in turn determines hypoxia potentials, internal nutrient regeneration and availability (Figures 4, 5, 6, 7), which in turn controls phytoplankton growth and bloom potentials. In turn, the magnitudes and aerial extent of blooms affect hypoxia potentials by controlling the formation and downward flux of organic matter providing the fuel for bottom water oxygen consumption. Therefore, the interacting and feedback effects of physical structuring with nutrient availability are key variables determining eutrophication and hypoxia dynamics.
In most instances, it is very difficult to control water quality and eutrophication by manipulating freshwater discharge. Exceptions would include aquaculture and retention ponds, small lagoons and reservoirs, where water input and flow can be tightly controlled. However, in large coastal watersheds, flow controls are neither technically nor economically feasible and realistic because large unpredictable weather events such as hurricanes as well as droughts tend to dominate hydrologic characteristics of these systems. This leaves nutrient and sediment inputs as the chief controllable variables.
| | | 10.2 Anthropogenic stressors |