


| | | 4.2 Long-term changes |
It has already been pointed out in several articles that prevailing weather conditions often cause natural fluctuations in time series of nutrient concentration values, and this may impede the detection of existing trends. Furthermore, a number of studies have shown that the level of nitrogen losses in individual years is influenced primarily by variations in precipitation and water discharge. Nutrient losses are also affected by changes in crop yields, which, in turn, are largely influenced by the weather conditions. Current hydrometeorological conditions other than water discharge can have an impact on phosphorus losses. For example, a study in Estonia and found that 20 times more phosphate phosphorus was released from frozen soils than in thawed soils. Accordingly, during periods including several mild winters, it could be expected that losses will either be increased due to an elevated risk of soil erosion, or be lowered due to less freezing out of plant residues, especially on grassland. In both cases, a detected trend might be falsely interpreted as being the result of changes in agricultural practices.
In a frequently cited study, Larsson and co-workers [278] reported that the total input of phosphorus to the Baltic Sea may have increased as much as ten times from the turn of the century to the 1980s, and they also claimed that the input of nitrogen may have increased about four times during the same period of time. Unfortunately, it is difficult to determine the exact size of the rise in nutrient loads due to uncertainty regarding the natural background concentrations and the impact of old agricultural practices. Nevertheless, it is indisputable that the present input of nutrients to the Baltic Sea by far exceeds the natural loading, and a more detailed discussion is needed to clarify the matter of when the major increases began.
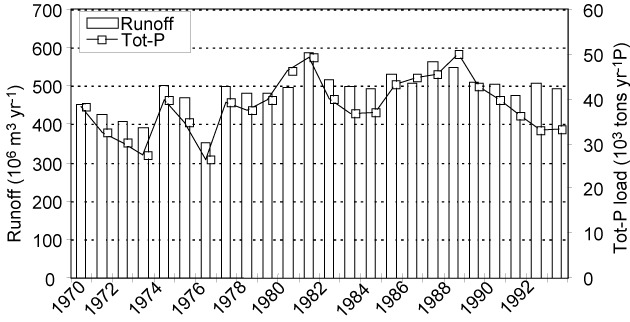
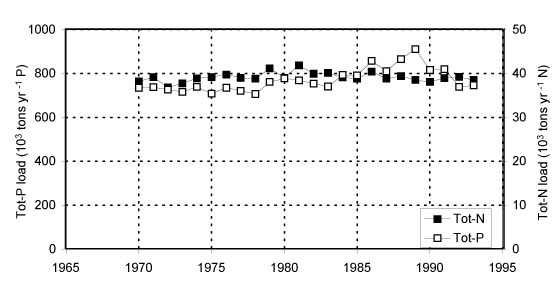
Let us first consider the past few decades, during which time the national water quality monitoring programs have covered a substantial part of the Baltic Sea drainage basin. The graphs in the following Figure include the period 1970 to 1993 and show our estimates of the annual riverine input of nutrients to the Baltic Sea as well as the in the area. As can be seen, the average input of both nutrients and water was slightly higher in the 1980s than in the 1970s. In addition, it is obvious that there is a strong correlation between the interannual variation in the nutrient loads and the runoff. Closer examination of the data showed that the input of nitrogen became practically constant when we normalized the estimated values to represent an average input of water to each of the main basins of the Baltic Sea (see Figure 3). Flow normalization of phosphorus had a similar effect, and the only temporal changes worth mentioning are a small increase in the 1980s and a minor decrease in the early 1990s.
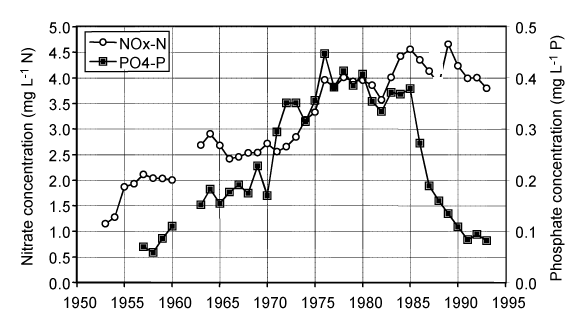
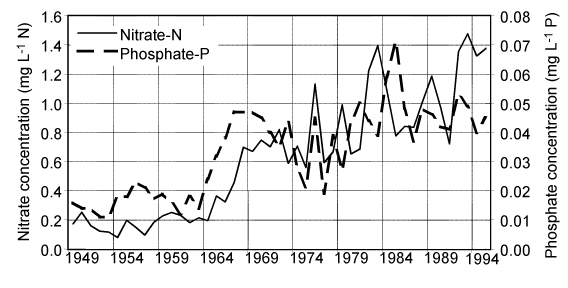
The longest time series with consistent water quality data for periods up to half a century exist in only a couple of rivers. The graphs in Figure 4 show annual flow-weighted mean values of nitrate and phosphate at Lobith on the Rhine River, near the border between Germany and the Netherlands. As can be seen, the nitrate concentration approximately tripled from the early 1950s to 1980. The phosphate concentration at the same site increased about fivefold from the late 1950s to 1980, when a massive action programme curbed the upward trend and turned it into a decrease. The time series of phosphate data from the Rhine River (Fig. 4) shows a very dramatic decrease in the mid 1980s, when several major point emissions of phosphorus were practically eliminated and phosphorus-containing detergents were phased out. Over less than a decade, the phosphate concentration in the river dropped from a very high level to the values that had prevailed in the 1950s. The measurements in the Daugava River appear to represent the longest series of nutrient concentrations data available for the Baltic Sea drainage basins. As can be seen in this Figure, the nitrate concentration in this river increased during the post-war period, and the critical decade was the 1960s. This is a decade later than in the Lower Rhine, for example.
Extending the time scale to a century or more provides mainly indirect information regarding nutrient trends in the rivers. Some of this information indicates that considerable changes in water quality may already have occurred in the 19th century, because, during that period in history, sewage emissions increased due to urbanization, and expanded tilling and ditching favored erosion and leaching processes. Studies of lake sediments have demonstrated that the loss of phosphorus increased long before commercial fertilizers became widely used.
Furthermore, both model calculations and the classical Rothamsted experiments show that older agricultural practices also resulted in substantial export of nitrogen to water. Notwithstanding, it is completely clear that the turnover of nutrients in the environment has accelerated since World War II, in particular due to increased use of commercial fertilizers, changes in the agricultural landscape and the formation of NOx in combustion processes.
| | | 4.2 Long-term changes |