

 |  |  | 3.4 Measurements of diffuse nutrient losses in the Nordic/Baltic region |
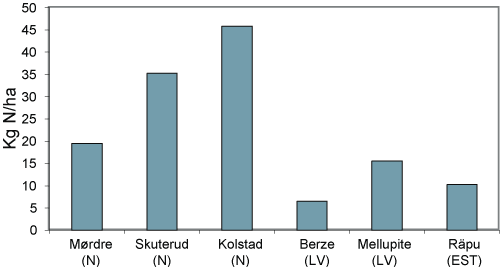
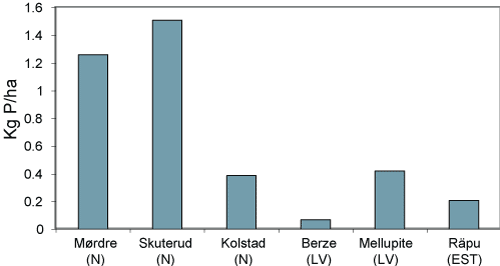
National programmes for monitoring nutrient losses from agricultural soils have a relatively short history in the Nordic-Baltic region. For example, such programmes were established in 1988 in Sweden, in 1989 in Denmark, and as late as 1992 in Norway. Finland has the longest tradition of monitoring agricultural losses, which was begun in 1962 in four agricultural streams. In Estonia, Latvia and Lithuania such programs were established in 1994/1995 through co-operation with Swedish and Norwegian research institutes. This has created scientific networks with mutual benefits concerning the understanding of the diffuse nutrient loss processes. Methodological aspects have played an important role in this co-operation. The emphasis on the harmonisation of methods concerning the measurement of nutrient loads from agriculture will be further strengthened through the implementation of the GEF/Baltic Sea Regional Project, and will apply to all Baltic States. A comparison of results from the Latvian and Estonian catchments with some of the results obtained in Norwegian catchments might be of interest. Figures 2 and 3 present the measured N losses (Total-N) and P losses (Total-P) in three Norwegian catchments, two Latvian catchments and one Estonian catchment, all characterised by cereal production and low-moderate animal densities. Weather conditions are rather similar, in terms of temperatures and mean annual precipitation (550-750 mm). Data cover the time period from 1994-1997.
Results show that both N and P losses are relatively high in the Norwegian catchments compared to the Estonian and Latvian catchments. This is also the case when compared with other Nordic countries. Annual mean N losses (Tot. N) in the Norwegian catchments ranged from around 20-45 kg ha-1, whereas the P losses (Tot. P) ranged from around 0.4-1.5 kg ha-1. N surpluses, defined as the difference between inputs (fertilisers, manure, atmospheric depositions) and outputs (yield withdrawals) showed only moderate variations between the Norwegian catchments (50-70 kg N ha-1). There were no particularly good correlations between the measured losses and the N surpluses, although some tendencies (increased losses by increased surpluses) may be observed for time records of individual catchments [38]. Previous investigations indicated correlations only at very high surpluses, e.g. due to severe crop failures [475].
It should be noticed that much higher losses were measured in two other Norwegian catchments, 70-80 kg N ha-1 and 2.0-2.5 kg P ha-1. However, these catchments were characterised by more complex crop rotation systems, whereas the annual precipitation was around 1000 mm yr-1.
In contrast, N losses in the Baltic catchments were 6-15 kg ha-1, whereas the P losses ranged from 0.07-0.4 kg ha-1. These losses are substantially lower than the observed losses in Norway, and even lower than most of the observations in other Nordic countries. At the same time, 10-20 times higher losses of both N and P were observed in some areas that belonged to industrialised, state-run pig farms during the Soviet era in Latvia.


The differences in N and P losses between the Norwegian catchments and the Estonian and Latvian catchments are too large to be explained simply by different management practices (generally larger fertiliser applications in the Norwegian catchments). Much higher soil erosion in the Norwegian catchments (Mørdre and Skuterud) is the main explanation for the differences in P losses. For N, however, the causes for the observed differences are probably much more complex. In short, it is suggested that a thorough look into the hydrological processes may be of great help in explaining these differences. The relation between fast flow processes and slow flow processes may be of particular interest. For N, the general conditions will be that the longer the water remains in the soil, the higher the potentials for e.g. denitrification. Denitrification and more or less temporal immobilisation of N may also occur in surface water channels, depending on e.g. flow velocity, easily available organic matter, vegetative growth, etc. Hydrograph recession analysis may give indications of water residence times in various catchments. The steeper the descending part of the hydrograph is (expressed by the recession coefficient), the faster the runoff response to a rainfall event. A comparative study of the Norwegian catchment on one side, and the Estonian and Latvian catchments on the other side, indicated significant differences with regard to recession coefficients [122]. There also appeared to be a rather good correlation between measured N losses and recession coefficients (Table 1).
| Average N losses, kg ha-1 | Average recession coefficient | |
| Skuterud (N) | 33 | 3.10 |
| Mørdre (N) | 20 | 1.54 |
| Berze (LV) | 12 | 0.77 |
| Rapu (EST) | 7 | 0.34 |
 |  |  | 3.4 Measurements of diffuse nutrient losses in the Nordic/Baltic region |