


| | | 21.3 Nutrient loading and phytoplankton |
The average phytoplankton biomass in Lake Võrtsjärv from May to October in 1963-2001 was 20 g WW m-3 (variation from 1 to 100 g WW m-3); in Lake Peipsi proper the respective value for 1962-2001 was 10 g WW m-3 (0.35-61 g WW m-3). Many species of bloom-forming cyanobacteria use molecular nitrogen at low N/P ratios if N is the limiting nutrient. Observing the changes in cyanobacterial dominance from the beginning of the 1960s in Lakes Peipsi and Võrtsjärv, one can notice an increase during the late 1960s and early 1970s, a decline during the late 1970s and 1980s, and another increase during the late 1990s in both lakes (Figure 4, [332]). Changes are much less pronounced in Lake Võrtsjärv than in Lake Peipsi. In Lake Võrtsjärv, the dominant cyanobacterial species Limnothrix planktonica, L. redekei, and Planktolyngbya limnetica are not able to fix N2; the main N2-fixing species, Aphanizomenon skujae, does not achieve dominant status. In Lake Peipsi N2-fixing species Aphanizomenon flos-aquae and Gloeotrichia echinulata prevail in summer phytoplankton. Since the beginning of the 1990s, the biomass of N2-fixing species has increased in both lakes.
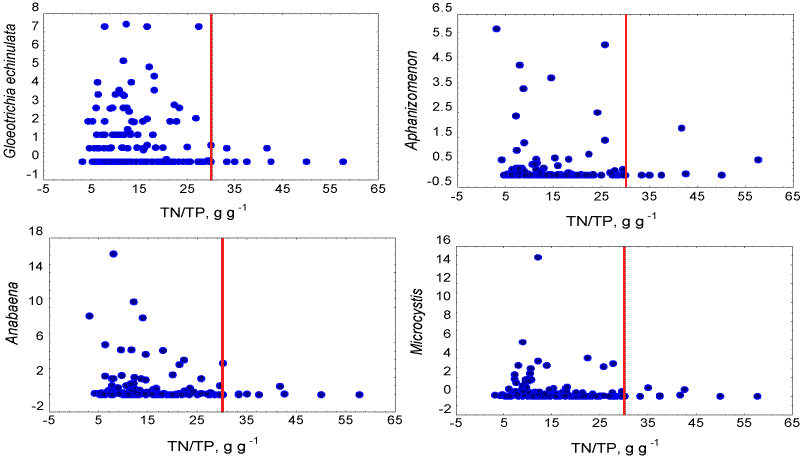
The increasing dominance of cyanobacteria and the occurrence of algal blooms in both lakes can be caused by reduced nitrogen loading and decreased TN/TP ratio. In Lake Peipsi a TN/TP mass ratio <30 seems to be critical for the development of predominant cyanobacterial species, both N2-fixing (Gloeotrichia echinulata, Anabaena, Aphanizomenon) and non-fixing (Microcystis) as seen in Figure 5.
| | | 21.3 Nutrient loading and phytoplankton |